
Sales Performance Dashboard – PowerBI
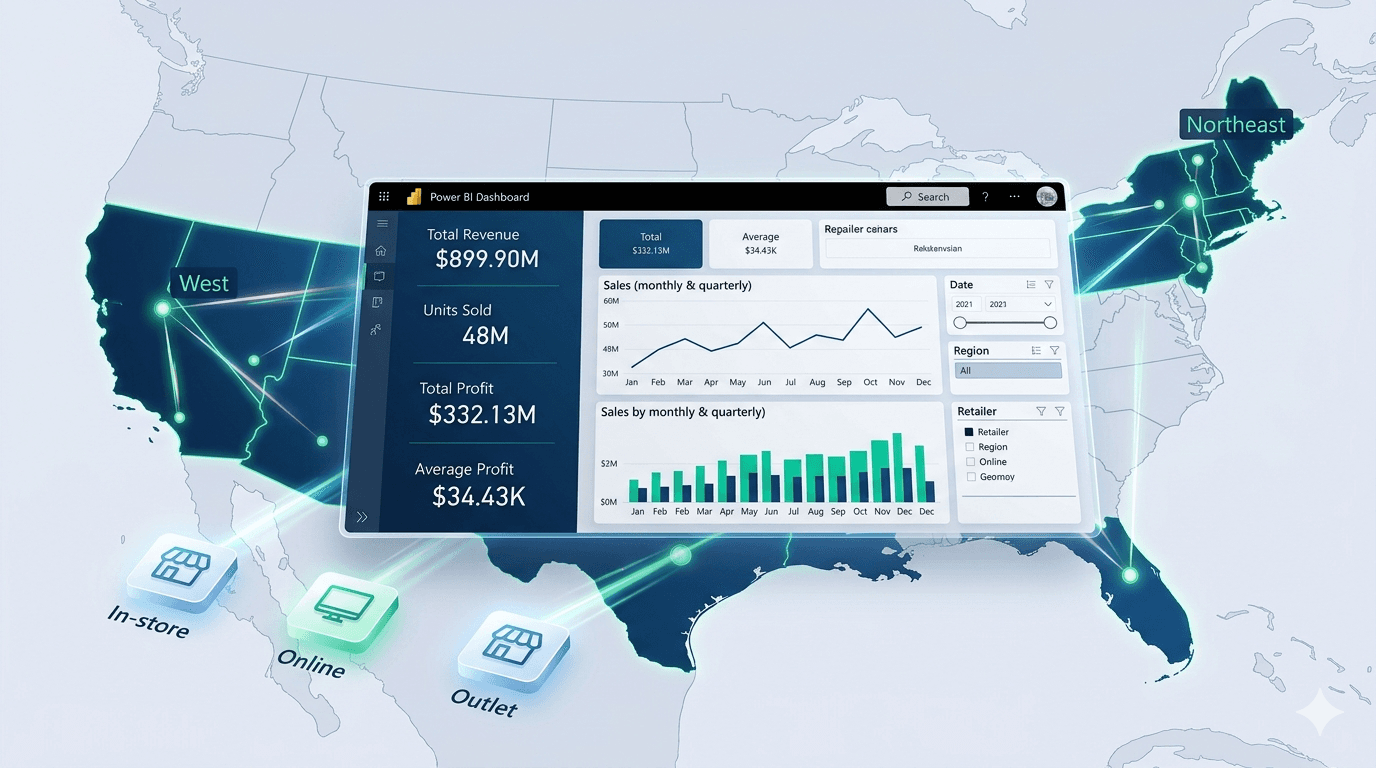
An enterprise solution providing sales leadership with unified visibility into pipeline health, team performance, and revenue forecasting across 1,200+ active opportunities spanning 6 regions. It replaced fragmented spreadsheet reports and legacy CRM exports with a self-service analytics platform.
The problem we solved
Regional managers manually aggregated forecasts via spreadsheets with ±22% variance and 2-day processing cycles. The organization faced poor pipeline hygiene due to inconsistent CRM usage and a lack of standardized stage definitions.
What we built
A star-schema data model in Azure Synapse powers the PowerBI frontend with 150+ custom DAX measures, AI-assisted forecasting, territory heat maps, rep-level scorecards, drill-through capabilities, and row-level security for regional data isolation.
The impact
Forecast variance decreased to ±14%, saving approximately £180,000 in resource-allocation costs. Sales-cycle length dropped 12%, and manager reporting time fell from 6 hours to under 30 minutes weekly.